The Descent: an iPhone Software Company's Struggle Part 2
The Descent: an iPhone Software Company's Struggle Part 2
Five days have gone by since the last installment and we’ve learned what has and hasn’t worked. Final Madness made it all the way to no. 13 in the Free Sports category. The March Madness app held tight for three days until dropping back to the twenties. I’ve crunched the numbers, made some predictions, and our team has restrategized. Want to know how many downloads it takes to break top 20? Wondering how many views you need for an ad strategy to pay off? Reflect7 has gone through the journey and made the mistakes so you don’t have to. Think of us as the tour guide that always dies in the horror movies, except with smaller man-boobs. So follow us down this dark cave as we explore the creepy caverns of the app store.
Brief Recap
How downloads correspond to rank:\
Last Saturday morning we were sitting in the mid 30s in the Free Sports category. We had high hopes for our conversion strategy: cross promoting to our other 60,000 sports fan customers. We’re still executing but it has already paid off.
Stats:
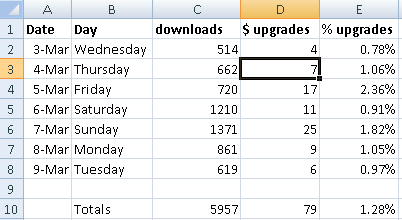
Saturday was big for us, propelling Final Madness to the top 15 spot in the Free Sports category. Sunday was even bigger, helping us climb all the way to number 13. We’ve learned that it takes about 1200 downloads to break top 15 in the Free Sports Category. It takes about 650-750 to place in the top 19th-22nd range. I’m estimating that we need around 1600 to break top 10 on the weekend and about 1300 to break in top 10 on a weekday.
Visibility:
So why do we care about getting to the top of an app category? Visibility. 80% of iPhone users purchase apps from their mobile device. 80% of apps sold are free. In order to be successful, Final Madness has to have a presence in two very important mobile lists.
1) Top 25 in Free Sports
2) Top 5 when a user searches for the term “March Madness”
Anything ranked lower is beyond the mobile default view and out of the users periphery.
It’s also important to make one app store desktop list:
1) Top 20 in Free Sports
This view is showcased on the sports category main page. Anyone perusing the sports section on their computer will be exposed to this list.
Guide Lesson: Visibility is key. If you can push your app to top 15 in it’s primary category, you’re getting great exposure where it counts.
**Monetization: Ads or In-App Upgrade\
**
Pleasure & Pain:
Our monetization strategy was simple. Offer a free, ad-supported app with the ability to upgrade to no-ads within the app. Motivational experts argue that there are two primal motivators for human action: Avoiding Pain and Seeking Pleasure.
Our strategy was to utilize these emotions in a way to maximize revenue. Here’s what we did:
Avoiding Pain:We placed ads in an area at the top of the app that would annoy the customer just enough to purchase the no-ads version. Honestly, I think they are only semi-annoying, if even that. JP wanted to play a Jonas Brothers song each time a team scored but I said, “JP, we want users to upgrade, not commit suicide.” So we left it out… for now.
Seeking Pleasure: If a customer upgrades, they will receive push notifications when a game ends. They will also get all of the brackets and stats from 2003 until present.
Right now our conversion rate is low (around 1.7%), and it might stay pretty low given that a lot of competition has entered the “Free” zone. I suspect we will see a higher conversion rate once March Madness actually starts.
Guide Lesson: If you have an upgrade mechanism, make sure to not only motivate your users with new features, but also with minor annoyances if they haven’t upgraded.
Adding it up:
We’re expecting ads to be our main source of revenue. As of midnight on Wednesday we’re sitting at a whopping \$24.05. That’s enough for JP to buy 24 McDoubles, or in Corey’s case, 10 Happy Meals.
Stats:
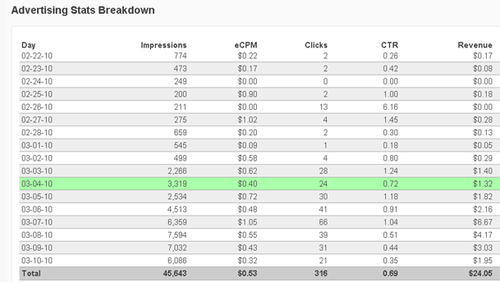
At the moment, we’re assuming that users are spending little time within the app because March Madness games don’t begin until next week. If you can afford the overhead and the programming time, I urge you to embed analytics code within your apps. Knowing how long each session is and what parts of your app customers are using is invaluable. Our ad server, Mobclix, has this code available and an analytics page that looks pretty snazzy.
I won’t go into the math, but we can guesstimate that the average time per Final Madness user is around 2.6 minutes. That’s enough time to see 6 ads (30 second ad rotation). The chart above shows that we have a .69% click-through-ratio (CTR) which has earned us an average of \$.53 eCPM (effective Cost Per Mille - for advertisers to display a thousand ad impressions in our app). Here’s the revenue table for Ad Impressions vs. eCPMs:
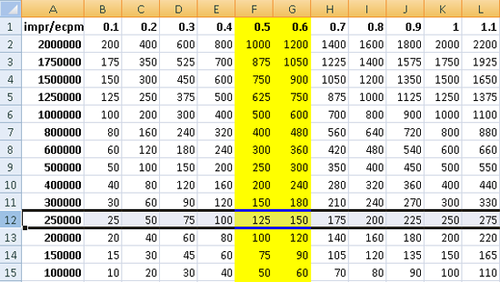
A very optimistic projection is that we will have 18,000 active users by March 18th (I’m thinking 16000, but with 18k, it’s easier to display the math). I also predict that users will double their daily time in our application to 5 mins 12 secs. We’ve lowered our ad rotation to 23 seconds so those users will see a daily average of 14 ads. If these numbers are close, then we should show around 252,000 ad impression each day (18,000 users x 14 ads per user). With Final Madness having a \$.53 eCPM, we will probably be making around \$125 per day.
As the chart shows, you have to have about 250,000 ads impression/day and attain a \$.57 eCPM to pull in about \$50k per year with your app. If you can increase your users session time, than you can dramatically increase the amount of ads you display.
Dead Ads:Part of attaining a high eCPM is getting rid of Dead Ads. Ads that your customers continually see and never click because they’re not interested in that product, or they already have it. The best way to do this is to serve up the greatest variety of ads possible. To accomplish this, you need to utilize as many ad networks as possible. Mobclix serves up ads from several different ad servers. They also allow open allocation for Admob and Google ads. If all goes well, we’ll be allocating 30-40% of our ads to Admob before March Madness begins. Hopefully, this strategy will raise our eCPM and put us in the .7-.8% category on the chart above. \
Guide Lesson: So when thinking about monetizing with ads, always use analytics to see how long users are in your app. We didn’t and now we’re left with very loose projections. In addition, try to minimize the number of dead ads you show by maximizing ad servers. This can raise your eCPM substantially with little work.
-Brian
**\
\
If you made it this far, you should follow me on Twitter. Follow @jprichardson
-JP